A portable device for optical assessment
of the cardiovascular condition
Janis Spigulis*, Maris
Ozols, Renars Erts and Karlis Prieditis
University of Latvia,
Physics Department and IAPS, Raina Blvd. 19, Riga, LV-1586, Latvia
ABSTRACT
A hand-held prototype device
for detection and processing of the tissue-remitted
optical signals has been developed and tested. The photoplethysmography (PPG)
principle was applied to follow the dilatation and contraction of skin blood
vessels during the cardiac cycle. Cardiovascular condition of the monitored
person was assessed by temporal analysis of the recorded PPG signals as well as
by shape analysis of the mean single-period PPG signals.
Keywords: Photoplethysmography, optical bio-sensing,
cardio-vascular equipment.
1. INTRODUCTION
The
human’s cardio-vascular condition can be assessed by various techniques, both
invasively and non-invasively. Photoplethysmography (PPG) is a non-invasive
method for studies of the blood volume pulsations by detection and analysis of
the tissue back-scattered (remitted) or absorbed optical radiation. Blood
pumping and transport can be monitored at different body locations - fingertip,
earlobe, forehead, forearm, etc. – with relatively simple and convenient PPG
contact probes.
Progress
in microelectronics and computer technologies has opened new possibilities to
improve the PPG sensing technology since its origins in 1937 1. PPG is becoming a powerful, safe and
easy-to-use tool for express diagnostics and early screening of cardio-vascular
pathologies, as well as for self-monitoring of the vascular condition. Tele-diagnostics by means of PC-connections
via Internet or LAN is another area where advanced PPG-technology becomes very
important.
In
general, each recorded PPG pulse can appear useful for cardio-vascular
assessment. However, all detected heartbeat pulses are not equal – the PPG
signal amplitude, baseline and period are changing with time 2. The
real bio-signals are fluctuating around the mean single-period photoplethysmography
(SPPPG) signal that can be determined by averaging a sequence 50…80 PPG pulses
with subsequent mean shape determination. Special hardware, algorithms and
PC-processing programmes were developed to obtain the mean SPPPG signals,
suitable for further clinical analysis 3-7.
Our
first table-top SPPPG sensor prototype devices had undergone several series of
clinical tests in laboratory, classroom and hospital environments. Analysis of
signals taken from numerous volunteers had lead to conclusion that each person
has his/her specific shape of the mean SPPPG signal and this
"SPPPG-fingerprint" reflects the individual's cardio-vascular
condition. This feature confirmed the diagnostic potential of the developed
devices; however, their hospital bed-site and field applications were limited
due to considerable weight and size.
As
the next step, we have recently developed a portable version of the
reflection-type PPG/SPPPG sensor device consisting of a universal contact
probe, bio-signal processing electronics and a lap-top computer. Design of the
new device will be described here, and some obtained clinical results will be
presented and discussed.
*)
E-mail janispi@latnet.lv, tel/fax
+371 7228249.
2. DESIGN OF THE DEVICE
The
basic design of the device is relatively simple. It consists of optical contact
probe, bio-signal amplifying/filtering circuit (both powered by a rechargeable
battery) and a lap-top computer with specially developed software for
AD-conversion, storage, processing and display of the PPG or SPPPG signals. All
equipment is placed in a hand-held case – see Fig. 1.
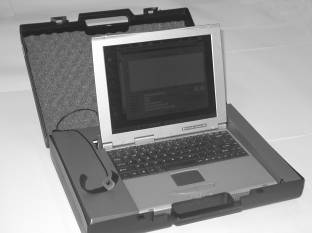
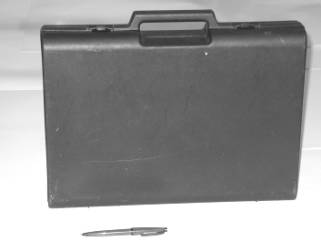
a b
Fig.
1. The hand-held equipment case: a – closed, b – open (dimensions: 44x32x9 cm,
weight: 4.1 kg).
2.1. The PPG
contact probe
The
optoelectronic contact probe continuously emits radiation into the under-skin
tissues with blood vessels and detects the AC-component of the back-scattered
radiation that reflects the blood volume pulsations. The probe comprises a GaAs
emitting diode
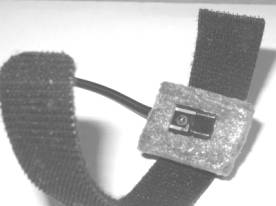
a b
Fig. 2.
The PPG contact probe (a) and its application for the fingertip monitoring (b).
(diameter
of the emitting area ~2 mm, power ~10 mW, peak wavelength ~940 nm), and a Si
photodiode with square detection area ~5x5 mm). Both diodes are closely mounted
on a soft plastic pillow and fixed onto the measurement site by means of a
sticky band – see Fig. 2,a. The band length is adjusted to the fingertip
measurements (Fig. 2, b); however, the band easily can be extended by spare
bands, if necessary, so providing possibility to take PPG measurements from
different locations of the body, e.g., forehead, neck, forearm, knee (Fig. 3).
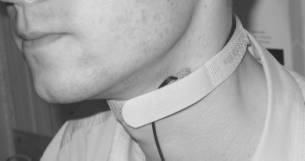
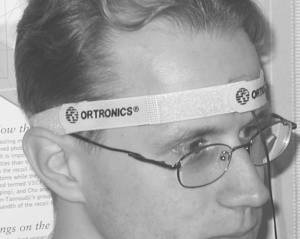
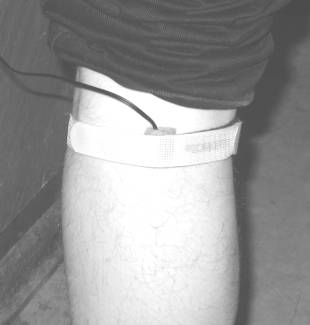
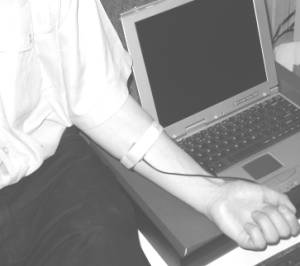
Fig.
3. Application of the PPG contact probe at forehaed, neck, forearm and knee.
2.2. Acquisition and
processingof the bio-signals
The
AC-component of the photodiode output signals is selected, pre-amplified and
converted into digital format, then accumulated and processed by the computer.
The signal amplitude-to-digital conversion is provided in somewhat original
manner, by means of the built-in computer sound card 8, 9. Frequency of the sinusoidal output
signal of the sound card determines the time resolution of measurements; in our
studies the upper limit for the sound card was 44 100 Hz, so theoretically
time interval around 23 microseconds between the neighbouring points could be
achieved. In order to save the resources, we selected 200 times lower working
frequency - 220.5 Hz; the corresponding time gap between the measured points
was less than 5 milliseconds, quite satisfactory for recording well-resolved
heartbeat signals.
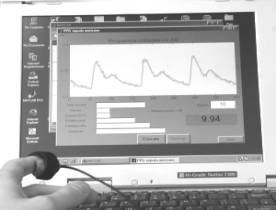
Special
software was developed for the PPG bio-signal acquisition, processing and data
storage, offering the following options:
·
Filling the first window for
patient data - name, age, gender, complains, doctor’s comments, etc.;
·
Pre-setting of the measurement time
schedule;
·
The PPG signal registration and
display in real time;
·
Signal clean-up (special filtering
algorithm) and calculation of the mean single-period PPG (SPPPG) signal shape;
·
Calculation of specific
cardio-vascular parameters for the registered signals - heartbeat rate, anacrota rise-time, time delay and
relative amplitude of the secondary peak (dycrotic
notch), etc.;
·
Display of the corresponding PPG
parameter set with subsequent cardio-vascular assessment results;
·
Storage of the
measurement/assessment data.
3. THE MEASUREMENT RESULTS: SOME EXAMPLES
The newly
developed bio-sensor device had undergone several tests, and some interesting
clinical results were obtained; they will be presented and discussed below.
Most of these measurements were taken from the middle fingertip of the left
hand.
3.1. The heartbeat
irregularities
We
observed and recorded several abnormalities of heart function, including
partial or total lack of one heartbeat in the cardiac sequence – see fig. 4.
Typically, the next heartbeat after the missing one is more intensive than
others in the sequence, so obviously the heart is auto-compensating the short-term
lack of blood pumping. The monitored
persons did not feel any discomfort during the missing heartbeat. This
phenomenon was recorded several times, so there was little doubt that both
persons had trouble with heart functioning, and they were recommended to visit
cardiologist for further investigations.
Consequently,
the new PPG sensor device appeared helpful for early warning of cardio-vascular
dysfunction, so it seems to have good potential for primary cardio-vascular
assessment and early screening of the risk patient groups in future.
a b
Fig. 4.
The observed heartbeat irregularities for two monitored persons.
3.2. Adaptation of the
cardio-vascular system to physical exercises
We
performed series of PPG measurements before and after intensive physical
exercises aiming to follow the cardio-vascular relaxation process that reflects
adaptability of the body to physical loads. The monitored volunteers were young
sportsmen (16-22 years) dealing with field athletics; the measurements were
taken in stadium right during their training.
Fig. 5, a
shows a typical relaxation process of the body as reflected by the PPG signals.
Right after the exercises the heartbeat rate is increased, but regular, and the
secondary (dycrotic) notch is nearly
disappeared; it gradually recovers with time – see the
a b
Fig. 5. A
normal (a) and arrythmic (b) response
of the cardio-vascular system to intensive physical exercises.
a b
Fig. 6.
The spasmatic peaks observed in PPG
signals recorded after intensive physical exercises.
signals 1
min. and 2 min. after the load. Fig. 5, b illustrates the over-load situation –
the heart function right after exercises is irregular, reflecting difficulties
of the cardiovascular system to adapt the increased physical load. One can see
that 1 minute of rest is enough to restore the regular cardiac cycle for this
particular person. The secondary notch is well pronounced as evidence of good
elasticity of the blood vessels.
We
observed also sharp spasmatic peaks
in the skin blood flow PPG signals immediately after the exercises (Fig. 6, a -
upper curve) or after a short relaxation time (Fig. 6, b - the next curve from
the top). Probably they can also serve as markers of the body adaptation to
physical loads; however, this effect has to be studied in more details before
drawing any conclusions.
3.3. The mean SPPPG signals
from different body sites

Fig. 7.
Comparison of the mean SPPPG signals taken at different body locations - middle
fingertips (both hands), forehead and carotid artery - for two persons.
Some of the
mean SPPPG signals taken at various locations of the body are presented on Fig.
7. Differences in shapes of the signals detected from the middle fingertips of
both hands, forehead and the carotid artery (on the neck) for the same person
were clearly observed. One can also note also person-to-person differences in
the mean SPPPG signals taken at the same locations of the body. Each of the
mean SPPPG signals obviously contains specific features related to the person’s
cardio-vascular condition to be assessed; the assessment criteria are still
elaborated in discussions with medical doctors.
4. SUMMARY
·
A small-size
portable PPG sensor device (44x32x9 cm, 4.1 kg,
battery-powered) is designed, constructed and tested.
·
The new contact
probe design provides reliable pulsating blood flow measurements at different
sites of the body.
·
Several
interesting clinical conditions have been recorded with the new device by
temporal analysis of the PPG signals – heartbeat irregularities, arrythmic and spasmatic responses to intensive physical exercises, right-left
hand fingertip blood flow differences, etc.
·
Shapes of mean
SPPPG signals recorded at various locations of the body contain valuable
cardiovascular information.
·
The proposed
approach and sensor design proved to be suitable for fast primary
cardiovascular assessment and early screening.
ACKNOWLEDGMENTS
The authors
are very grateful to Dr. Indulis Kukulis for his valuable clinical comments.
Financial support from Latvian Council of Science (grant # 01.0067) and
Ministry of Education and Science (grant # TOP 02-13) is highly appreciated.
REFERENCES
1.
A. B. Hertzman,
“Photoelectric plethysmograph of the finger and toes in man”, Proc. Soc. Exp. Biol. Med. 37, pp. 1633-1637, 1937.
2.
M. Nitzan, H. de
Boer, S. Turivnenko et al., “Power spectrum analysis of spontaneous
fluctuations in the photoplethysmographic signal”, J. Bas. Clin. Physiol. Pharmacol., 5, No. 3-4, pp. 269-276, 1994.
3.
J. Spigulis, U.
Rubins, “Photoplethysmographic sensor with smoothed output signals”, Proc. SPIE. 3570, pp. 195-199, 1998.
4.
G. Venckus, J.
Spigulis, “Frequency filtering effects on the single-period
photoplethysmography signals”, Med. Biol.
Eng. Comput., 37, Suppl. 1, pp.
218-219, 1999.
5.
J. Spigulis, G.
Venckus, “Single-period photoplethysmography: a potential tool for noninvasive
cardiovascular diagnostics”, Springer
Series “Optics for Life Sciences” OFLS-VI,
Berlin (in press).
6.
J. Spigulis, G.
Venckus, M. Ozols, “Optical sensing for early cardiovascular diagnostics”, Proc. SPIE 3911, pp. 27-31, 2000.
7.
J.
Spigulis, I. Kukulis, E. Fridenberga, G. Venckus, “Potential of advanced
photoplethysmography sensing for non-invasive vascular diagnostics and early
screening”, Proc. SPIE 4625, pp.
38-43, 2002.
8.
M. Ozols, J.
Spigulis, “Acquisition of biosignals using the PC sound card”, Proc. Int. Conf. “Biomedical Engineering”
(KTU, Kaunas, LT), pp. 24-27, 2001.
9.
M. Ozols, J.
Spigulis, “Analog-to-digital conversion of bio-signals by means of the PC sound
card“, Proc. Baltic Electronics
Conference BEC’2002 (TTU, Tallinn,
EE), 2002 (in press).