Micro-circulation of skin blood: optical monitoring by
advanced photoplethysmography techniques
Janis Spigulis*, Renars Erts and
Uldis Rubins
ABSTRACT
Blood micro-circulation in
upper skin layers has been detected in real time by advanced two-channel
photoplethysmography techniques. Design of the sensor
device is described, along with results of blood flow measurements and model
calculations.
Keywords:
Photoplethysmography, optical bio-sensing, cardio-vascular assessment.
1. INTRODUCTION
Micro-circulation
of skin blood is a subject of considerable physiological
interest due to its role in human metabolism and thermoregulation. There are several techniques used to follow the blood flow in living
tissues. Optical methods seem to be the most promising for skin
microcirculation studies, since the penetration depth of optical radiation is
relatively small, typically 0.1…3 mm dependently on the radiation wavelength.
Therefore analysis of the skin back-scattered optical radiation provide
valuable selective information on blood flow only in upper skin layers, cutting
off the influence of the deeper arteries and veins.
The non-invasive reflection photoplethysmography (PPG) method uses the back-scattered optical signals for temporal analysis of the skin blood volume pulsations. The periodical increase of blood volume in micro-vessels due to their dilatation (expansion) during the systolic raise of pressure with the following diastolic contraction (relaxation) over each heartbeat causes corresponding changes in absorption of optical signals traveling within the working volume. Consequently, the time-dependent parts of the properly filtered PPG signals adequately reflect the skin blood volume pulsations during microcirculation.
The
PPG techniques have been substantially improved since its origins 1,
thanks to the fast development of microelectronics and computer technologies.
That opens new horizons for implementation of this method in clinical praxis,
self-monitoring and tele-medicine.
We
have previously studied several options of the PPG signal analysis potential
for obtaining information on skin vascular processes and assessment of eventual
vascular pathologies:
-
shape analysis of individual
PPG heartbeat pulses and time-averaged single-period PPG signals 2,
-
temporal analysis of
fluctuations in heartbeat rate and other PPG signal parameters at steady-state
conditions 3,
-
analysis of changes in PPG
signals under influence of stress, physical exercises or other external factors
4,
-
analysis of the pulse wave
propagation in blood vessels by means of the two-channel PPG techniques 5.
Two
models of the PPG sensor equipment have been developed and clinically tested at
*) E-mail janispi@latnet.lv, tel/fax +371 7228249
2. THE PORTABLE TWO-CHANNEL
PHOTOPLETHYSMOGRAPHY SENSOR DEVICE
Recently a
portable two channel reflection-type PPG sensor device comprising a set of
universal contact probes, bio-signal processing electronics and a lap-top
computer has been developed - see Fig. 1.

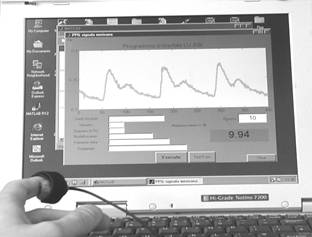
Fig. 2. Application of the PPG contact probe at the neck.
a b
Fig. 1. The portable
PPG sensor device: a – general view, b – detection of the fingertip PPG
signals.
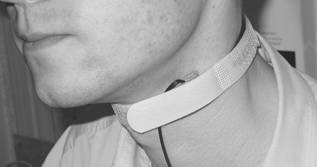
Fig. 2. Application of the contact probe on neck.
The basic design
of the device is relatively simple. It consists of two optical contact probes,
bio-signal amplifying/filtering circuit and a lap-top computer with specially
developed software for AD-conversion, storage, processing and display of the
PPG signals. All equipment is powered by a rechargeable battery and placed in a
hand-held case (dimensions 44x32x11 cm, weight 4.1 kg). The contact probe
continuously emits radiation into the skin tissues containing blood
micro-vessels, and detects the AC-component of the back-scattered radiation
that reflects the blood volume pulsations. The probe comprises a GaAs emitting diode
(diameter of the emitting area ~2 mm, power ~10 mW, peak wavelength ~ 940 nm),
and a Si photodiode with square detection area ~5x5 mm). Both diodes are
closely mounted on a soft plastic pillow and fixed onto the measurement site by
means of a sticky band. The band length is adjusted to the fingertip
measurements; however, the band easily can be extended by spare bands, if
necessary, so providing possibility to take PPG measurements from different
locations of the body, e.g., forehead, forearm, knee, neck (Fig. 2).
The AC-component of the
photodiode output signals is selected, pre-amplified and converted into digital
format, then accumulated and processed by the computer. The signal sampling
rate can be changed; the time resolution about 5-10 milliseconds appeared to be
quite satisfactory for recording of well-resolved heartbeat signals. Parallel
real-time detection and recording of two PPG signals from different body sites
was ensured by originally developed electronic circuit.
Special software was developed for the PPG
bio-signal acquisition,
processing and data
storage, offering various options, e.g.
·
Filling the first window for
patient data – name, age,
gender, complains, doctor’s comments,
etc.;
·
Pre-setting of the measurement time
schedule;
·
The PPG signal registration and
display in real time;
·
Signal clean-up (special filtering
algorithm) and calculation of the mean single-period PPG (SPPPG) signal shape;
·
Calculation of specific
cardio-vascular parameters for the registered;
·
Display of the corresponding PPG
parameter set with subsequent cardio-vascular assessment results.
3. THE MEASUREMENT RESULTS: SOME EXAMPLES
The newly developed
bio-sensor device had undergone several tests, and some interesting clinical
results will be presented and discussed below.


Fig. 3. Comparison of the mean SPPPG signals taken at different body locations – middle fingertips (both arms), forehead and carotid artery – for two persons.
Fig. 4. The observed changes in shapes of the skin SPPPG signals at various contact site distances from the arteries:
a – Carotid artery, b – Temporal artery.
The mean single-period PPG (SPPPG) signals taken at four locations of the body for two persons are presented on Fig. 3. Differences in shapes of the signals detected from the middle fingertips of both arms, forehead and the carotid artery (on the neck) for the same person were clearly observed. One can also note also person-to-person differences in the mean SPPPG signals taken at the same locations of the body. Each of the mean SPPPG signals obviously contains specific features related to the person’s cardio-vascular condition; the assessment criteria are still elaborated in discussions with medical doctors.
As mentioned above, the limited penetration depth of the optical radiation (~ 2-3 mm under the skin surface for the wavelength range used in this study) is the reason why the PPG signals selectively reflect mainly the blood micro-circulation in the upper skin layers. Additionally, in the vicinity of arteries the arterial blood flow also influences the PPG signal shape. For instance, Fig. 4 illustrates the recorded mean SPPPG signal changes when the contact probe was placed at different distances from the artery projection to skin surface; two arteries (carotid and temporal) were regarded. The SPPPG signal recorded right over the artery obviously comprises two components of the blood volume pulsations, originated by subcutaneous micro-circulation and arterial macro-circulation. Most probably, each of them can be separated by means of proper signal analysis algorithms. Possibility to extract the arterial pulsations from the integral PPG signals would give additional advantages to the PPG methodology. In particular, it would help to increase accuracy of the pulse wave velocity measurements using the two-channel method.
Many
PPG studies have been performed using fingertip as the measurement site. The
fingertip PPG signals are relatively strong thanks to the anatomical feature -
large vascular bed and, consequently, total volume of the pulsating blood. This
is a typical peripheral blood supply situation when the artery pulse waves can
be substantially re-shaped during their propagation via the highly resistant
micro-vessels. The fingertip signals sometimes are pretty complicated, e. g.
including two secondary peaks (notches) – see Fig. 5. The question - weather or
not the fingertip PPG signals are suitable for physiological assessment - is still
broadly discussed.

Fig.5. The
observed fingertip PPG signal with two notches. Fig.6.
The time-shifted PPG signals recorded
simultaneously at the fingertip and toe.
Advantage of the newly developed
two-channel approach is the availability of additional diagnostic information
on the vascular blood flow resistance – it can be obtained by measuring the
heartbeat wave propagation time between two body sites as the time shift between
the two corresponding PPG pulses. For example, Fig. 6 illustrates distinct time
delay between the PPG signals recorded simultaneously at the left fingertip and
left toe. Time resolution of the device is ~ 0.01 s (it can be improved for an
order of magnitude, if necessary), so reliable blood pulse wave propagation
velocity estimations for diagnostic needs can be provided in this way.
4. THE VASCULAR MODELING AND SIMULATION
There
are many open questions regarding the skin blood micro-circulation, therefore
modeling and computer simulation of the vascular blood flow dynamics could be
very helpful. In order to interpret the recorded shapes of PPG signals, a
simple vascular model is regarded below, with assumption that the blood vessel
elasticity assures linear proportionality between the blood volume and the
blood pressure pulsations.
The
blood pressure changes induced by heart contractions are propagating along the
blood vessels as pulse waves, with subsequently pulsating blood flow. The human
vascular system is elastic and multi-branched, and each branching partially
reflects back the pressure wave. The whole vascular network from aorta till
capillaries consists of numerous Y-branches, therefore
modeling of a single Y-branching situation (Fig. 7) is very important. The relationship between incoming, outgoing and reflected
pressures in this case can be represented by the following equations 6 :
and
where ![]() is the peripheral reflectance,
is the peripheral reflectance, ![]() – the peripheral
permeability at the vessel’s branch,
– the peripheral
permeability at the vessel’s branch,![]() – incoming pressure,
– incoming pressure, ![]() – reflected pressure,
– reflected pressure, ![]() and
and![]() – pressures in respective outgoing branches,
– pressures in respective outgoing branches, ![]() – blood flow impedance
of the base vessel,
– blood flow impedance
of the base vessel, ![]() ,
,![]() – impedances of the
branched vessels. Impedance Z is a physiologically significant vascular
parameter:
– impedances of the
branched vessels. Impedance Z is a physiologically significant vascular
parameter:
![]() ( 3 ),
( 3 ),
where![]() is the density of blood,
is the density of blood, ![]() - pulse wave
propagation velocity and
- pulse wave
propagation velocity and ![]() - the blood vessel
cross-section.
- the blood vessel
cross-section.
Fig. 7. Model of the Y-branched blood
vessel.
The
dynamic pressure (and volume) changes represent superposition of the incoming
and reflected pressure waves. To simulate the temporal behavior of pressure
changes at the system output, the incoming pressure waveform is considered to
be the Gaussian function:
![]() (4),
(4),
where ![]() is amplitude of the
pulsating pressure,
is amplitude of the
pulsating pressure, ![]() – Gaussian rise-time
and
– Gaussian rise-time
and ![]() – Gaussian bandwidth.
The branching back-reflected pressure wave then will reach the base vessel
entrance after traveling the distance 2L:
– Gaussian bandwidth.
The branching back-reflected pressure wave then will reach the base vessel
entrance after traveling the distance 2L:
 (5).
(5).
Generally,
multiple reflections may be expected within the base segment and branches, if
the input and output are reflective, too. The basic expression for temporal
behavior of the outgoing blood pressure via the branch 1 in frame of such
multi-reflection approximation can be represented as follows:
 (6),
(6),
where ![]() - the output pressure,
- the output pressure,
![]() - number of
reflections in the base,
- number of
reflections in the base, ![]() - number of
reflections in the branch, , R0 – reflectivity of the base input, R1
– reflectivity of the branch output, L1 - length of the branch.
- number of
reflections in the branch, , R0 – reflectivity of the base input, R1
– reflectivity of the branch output, L1 - length of the branch.
Equation
(6) was used to simulate the pressure waveforms for the case with two equal
output branches of diameters twice smaller than that of the base vessel.
Calculations were performed for situations without reflections and with one,
two and three reflections, using the following model parameters: t0
= 0.25 s, a = 100 s-2, Z1 = Z2 = 4Z0, R0
= 0.5, R1 = R2 = 0.33, T = 1.33, L1 = L2
= 0.75 L, L/c = 0.2 s, L1/c = L2/c
= 0.15 s, n = m = 3.
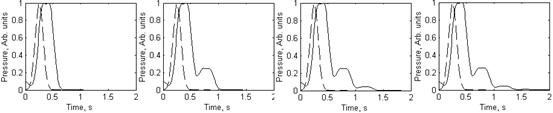
a b c d
Fig.8. The blood pressure
waveforms in the branch output: a - without reflections (dashed line – the
input Gaussian waveform), b - with one reflection, c - with two reflections, d
- with three reflections.
The simulation results are presented at Fig. 8. The
time shift between initial pressure pulse (dotted curve) and output pressure
signal is well pronounced in all cases. Each reflection causes one additional
peak in the output signal; however, the amplitudes of reflected signals are
falling very fast, so the influence of the third reflection to the integral
signal shape practically can be neglected (Fig. 8, d). One can note that the
simulated two-reflection signal shape (Fig. 8, c) contains two “notches”,
similarly to the observed mean SPPPG signals taken from fingertip (Fig. 5).
5. CONCLUSIONS
We tried to find answers to
the following questions:
1.
Can the newly developed PPG sensor
device be useful for studies of skin blood micro-circulation dynamics?
2.
Can we detect/separate the micro-circulation
and arterial macro-circulation influences in the recorded PPG signals?
3.
Can we determine directly the pulse
wave propagation velocity in arteries by the two-channel PPG techniques?
4.
Is there a way to set-up a simple
model of the skin blood micro-circulation dynamics being in general agreement
with the experimentally obtained data?
This
pilot study gave evidence that all the above questions can be answered
positively. Of course, additional studies are necessary to characterize the
numerous specific situations in details. Further studies on the mentioned
topics are underway.
ACKNOWLEDGMENTS
The authors are deeply grateful to Prof. Juris Aivars and MD Indulis Kukulis for valuable discussions. The financial support from Latvian Council of Science (grant # 01.0067) and Ministry of Education and Science (grant # TOP 02-13) is highly appreciated.
REFERENCES
1. A. B. Hertzman, “Photoelectric plethysmograph of the finger and toes in man”, Proc. Soc. Exp. Biol. Med. 37, pp. 1633-1637, 1937.
2. J. Spigulis, G. Venckus, M. Ozols, “Optical sensing for early cardiovascular diagnostics”, Proc. SPIE 3911, pp. 27-31, 2000.
3.
K. Prieditis,
“Detection and computer processing of the photoplethysmography
bio-signals”, BSc Thesis, University of
4.
J. Spigulis, I. Kukulis, E. Fridenberga, G. Venckus,
“Potential of advanced photoplethysmography sensing
for non-invasive vascular diagnostics and early screening”, Proc. SPIE 4625,
pp. 38-43, 2002
5.
J. Spigulis,
M. Ozols, R. Erts, K. Prieditis, “A portable device for optical assessment of the
cardiovascular condition”, Proc. SPIE 5123, pp. 313-319, 2003.
6.
C. Caro, T. Pedley,
R. Schroter, W.Seed, The
mechanics of the circulation, Oxford University Press, NY-Toronto, 1978.